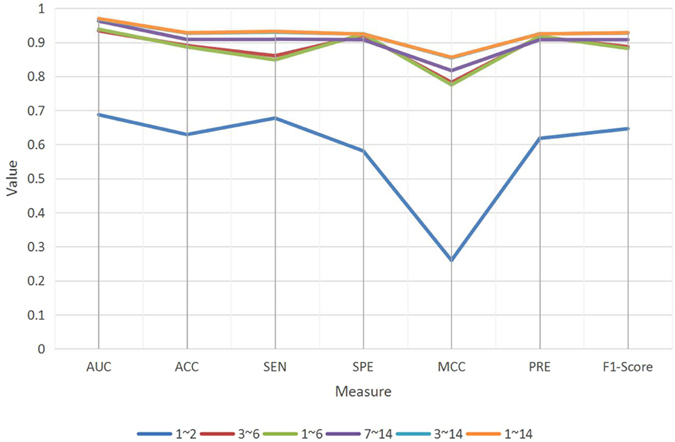
Figure 3.

The performance comparison of different paths. The X-axis represents different performance measures and the Y-axis indicates the values of these measures. The colored lines denote the performances of different paths.

The performance comparison of different paths. The X-axis represents different performance measures and the Y-axis indicates the values of these measures. The colored lines denote the performances of different paths.