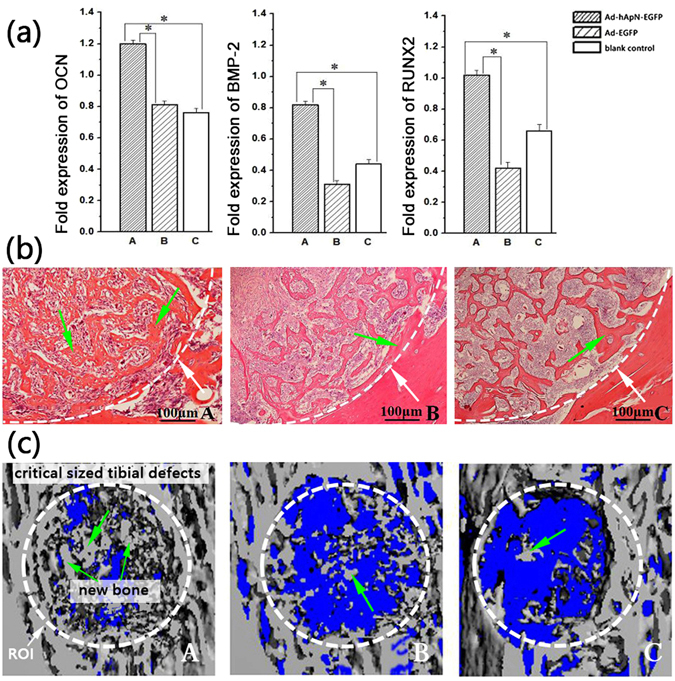
Figure 10.

Osteogenesis detection in bone defect areas. (a) The expression of osteogenesis related genes on the 7th postoperative day, including OCN, BMP-2 and RUNX2. These three genes were significantly increased in group A compared with the other two groups. *P < 0.05; (b) Haematoxylin and eosin staining of bone defect areas on the 7th postoperative day. The white arrow indicated the bone defect edge. More new trabecular bone (green arrow) in group A; (c) Three-dimensional micro-CT images of bone defect areas. The white line dotted the region of interest area. More new bone (green arrow) were found in group A.
