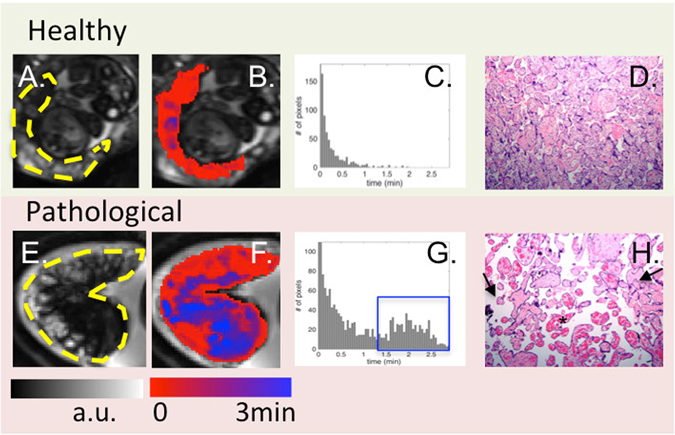
Figure 3.

From left to right: BOLD images, TTP maps, histogram of TTP distribution and histology (10X). One control (top) is compared to one case with abnormal placental pathology (bottom). Yellow dashes in A and E outline the placenta. For healthy subjects, TTP values were short and placental histology was normal. For pathological cases, TTP values were longer and less uniform (blue regions in (F) and blue box in (G)). Arrows in H point to avascular villi and the star identifies chorangiosis.
