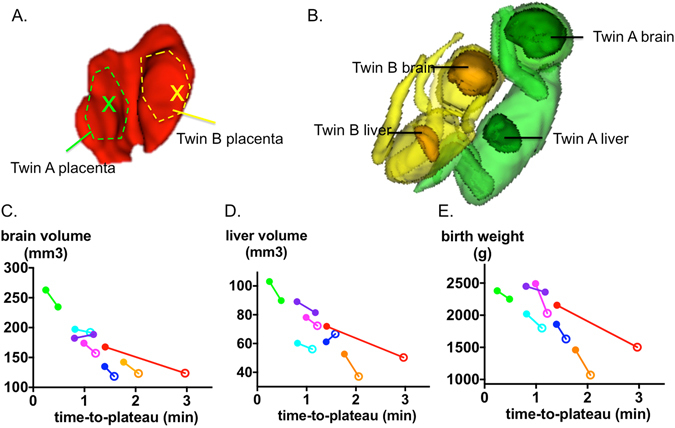
Figure 4.

Illustrations of segmentation volumes and of mean time-to-plateau (TTP). (A) placenta for the discordant twin pair with indication of ROI segmentation used for the average TTP calculation. (B) 3D view of segmented fetal brains and livers in the corresponding discordant twin pair (red points in (C–E) below). (C–E) Brain volume, liver volume and birth weight respectively as a function of the average TTP. The brain and liver volume were measured at the time of the scan. Twin pairs are connected by solid line, and are assigned same color. Hollow circles denotes fetuses that proved to be SGA at birth.
