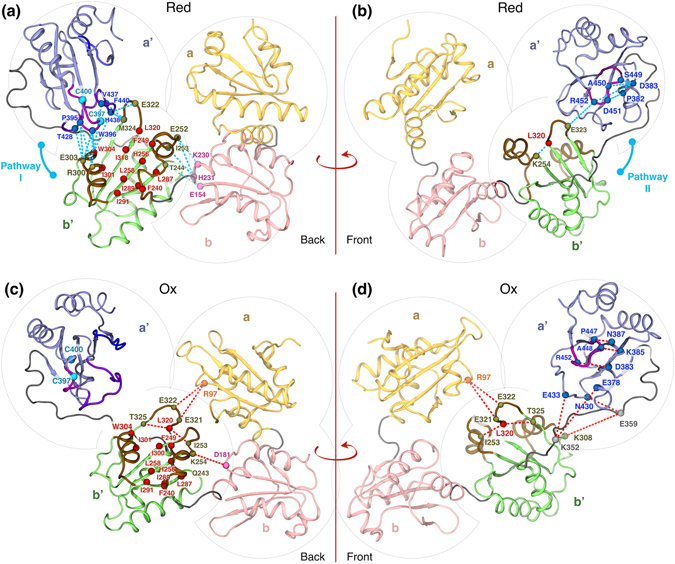
Figure 8.

Red- (a and b) and ox- (c and d) dominated residue-residue interaction networks on two representative conformations of red- and ox-hPDI (C3 and C6 of FEL) between the b’ and a’ domains. Residues (Cα) within the hydrophobic pocket in each state are colored in red. Red and blue dash-lines indicate the ox- and red-dominated interactions, respectively. Secondary structures involve in formation of the upper edge of hydrophobic pocket are colored in brown (H9, H11 and LB14-B15). Secondary structures of a’ domain that contribute in b’a’ interactions are colored in violet (LB17-H15, LB18-B19 and LB19-B20).
