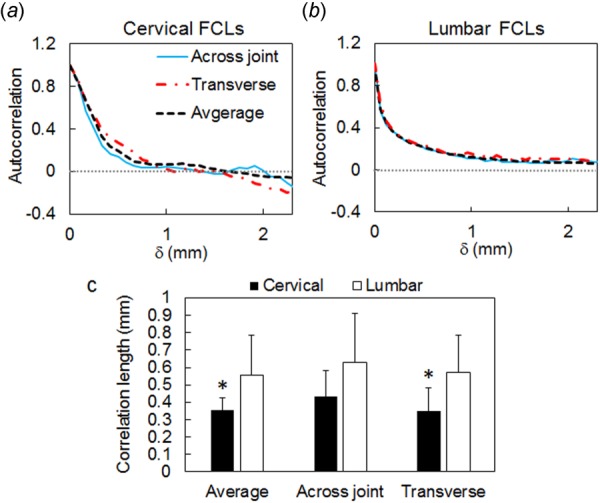
Fig. 5.

Spatial correlation of orientation in cervical and lumbar FCLs in the prestressed resting configuration. Representative autocorrelation curves are shown for (a) a cervical FCL (sample C2) and (b) a lumbar FCL (sample L3) in the across-joint direction, in the transverse direction, and averaged over all directions. Spatial correlation in both cervical and lumbar FCLs exhibits an initial drop within 1 mm. In the cervical region, correlations vanish beyond this distance, while in the lumbar samples correlations are longer ranged. (c) Comparison between correlation length, c, shows an overall significant difference due to anatomical region of the FCLs (p = 0.037). The correlation length in the cervical FCL is significantly smaller than that in the lumbar region in the average and transverse directions (*p < 0.022), indicating higher heterogeneity in the cervical FCLs compared with lumbar FCLs. Error bars indicate standard deviations.
