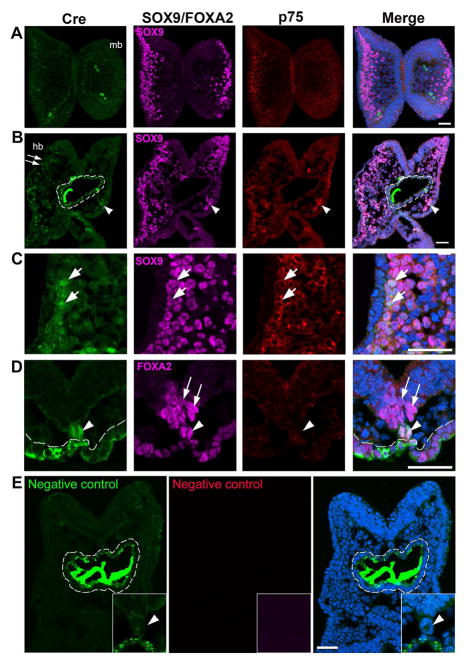
Fig. 4.
Immunoreactivity of Cre (green, A–D), SOX9 (purple, A–C) or FOXA2 (purple, D), and p75 (red, A–D) in transverse sections of a 7-somite P0-Cre embryo at the midbrain (A) and hindbrain-forebrain (B–E) levels. Arrows in C (high magnification of squared region in B) point to some of the triple labeled Cre+SOX9+p75+ cells in the NC cell region. Arrowheads in D point to Cre+ cells co-labeled with FOXA2 in the notochord region and arrows to FOXA2+ cells in the floor plate of neural tube (D). White dashed lines outline the foregut diverticulum (B, D, and E). In the negative control slide (E), primary antibodies were omitted and only secondary antibodies were applied. Scale bar: 50 μm for all images (single-plane laser scanning confocal).

