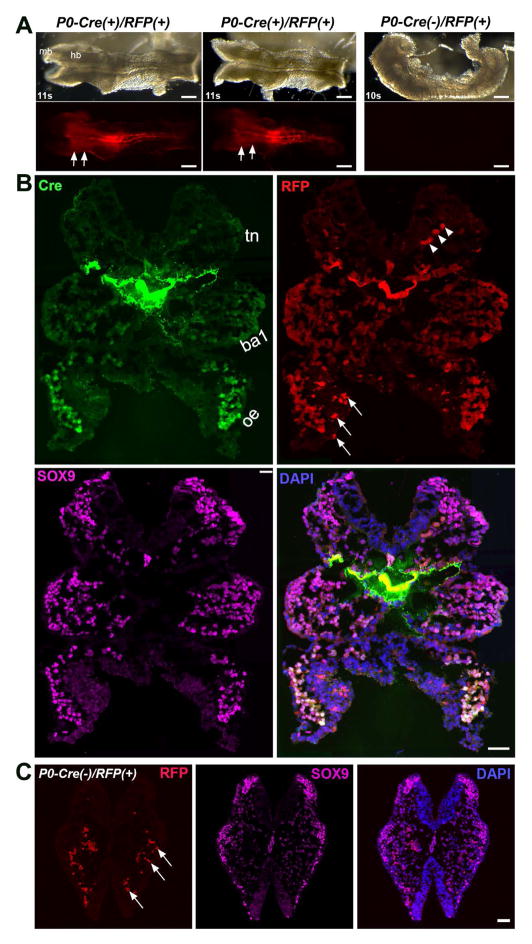
Fig. 7.
Consistent distribution of Cre and RFP signals in P0-Cre/R26-RFP embryos with that in P0-Cre and P0-Cre/R26-lacZ embryos. A: Bright-field (top panel) and fluorescent (bottom panel) images of whole P0-Cre/R26-RFP embryos at 10–11 somite stages. Arrowheads point to the midbrain (mb) region that was devoid of RFP signals. Arrows point to the hindbrain region labeled with RFP. B: Single-plane laser scanning confocal photomicrographs of a transverse section of an 11-somite P0-Cre(+)/R26-RFP(+) embryo at the hindbrain level. An increasing intensity gradient of Cre and RFP signals from the dorsal to ventral region, i.e., faint and sparse in the trigeminal NC (tn), clear and frequent in the branchial arch 1 (ba1), bright and almost all in the optic eminence (oe). Arrowheads point to the autofluorescent blood cells. Arrows point to some non-cellular RFP+ fragments. C: Confocal images of a transverse section of a 10-somite Cre− embryo to illustrate the autofluorescent blood cells and non-cellular RFP+ fragments (arrows). Scale bars: 200 μm in A; 50 μm in B and C.

