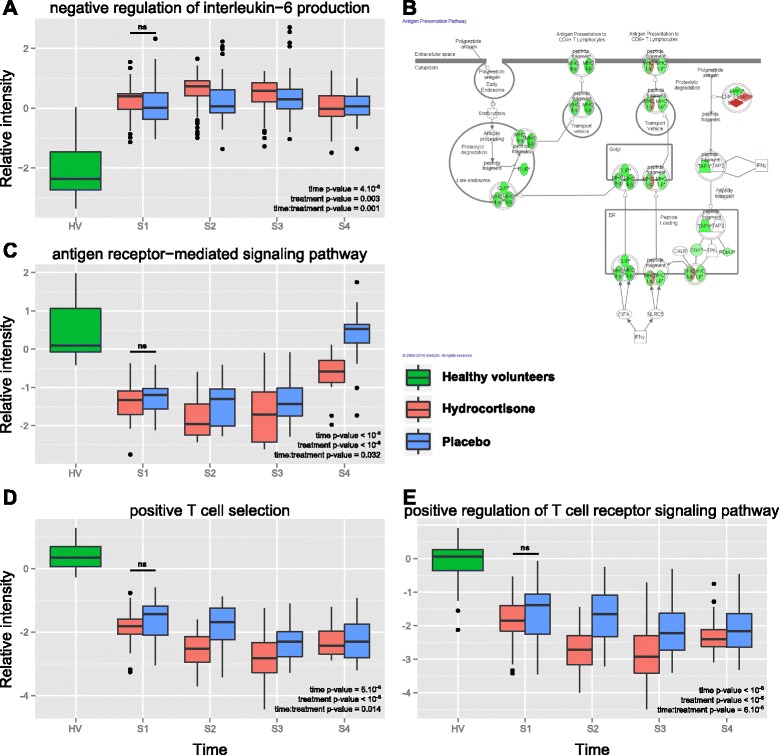
Fig. 4.

Modulation of the immune response by hydrocortisone. Summary of the effect of hydrocortisone administration on gene expression in healthy volunteers (green), hydrocortisone-treated patients (red) or placebo-treated patients (blue) for various components of the immune response. a. Negative regulation of IL-6 production [GO:0032715]. c Antigen receptor-mediated signaling pathway [GO:0050851]. d Positive T cell selection [GO:0043368]. e Positive regulation of the T cell receptor signaling pathway [GO:0050862]. The statistical significance of the observed differences was assessed using repeated measures analysis of variance, taking into account treatment, time and gene (probes) effects. b Ingenuity Pathway Analysis® representation of the antigen presentation pathway, where components are color coded according to relative gene expression between hydrocortisone-treated patients and placebo-treated patients at S4. S1 to S4 sample times day 0, day 1, day 5 and day 7, respectively, HV healthy volunteers, ns not significant
