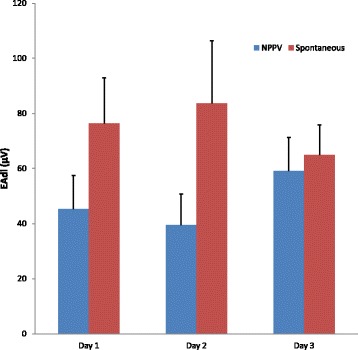
Fig. 4.

Mean EAdi values during NPPV (blue bars) and spontaneous breathing (red bars). Notice that EAdi is smaller on NPPV compared to spontaneous breathing on Days 1 and 2, but not on Day 3. Bars represent the mean and error bars represent the standard deviation. EAdi: Electrical activity of the diaphragm; NPPV: Noninvasive Positive Pressure Ventilation
