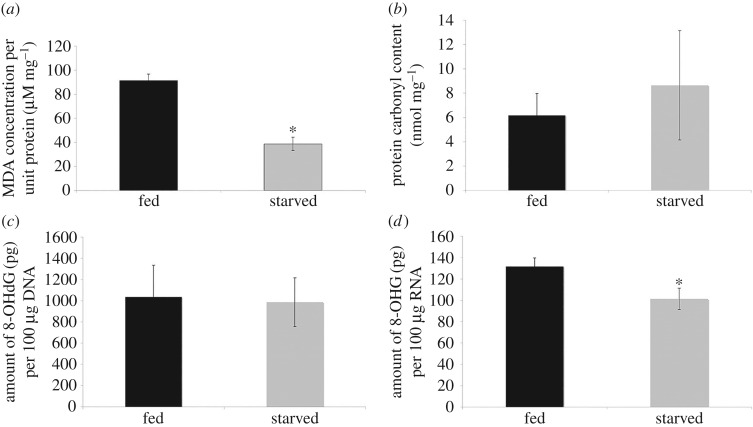
Figure 3.
Bar graphs depict the oxidative damage biomarkers in amoeba C. carolinense cells. Lipid peroxidation (a) and RNA oxidation (d) were significantly lower in starved amoeba C. carolinense cells when compared with fed cells, while protein (b) and DNA (c) oxidation were not significantly different. Data presented as means ± s.d. of five independent experiments. *p-value < 0.05.

