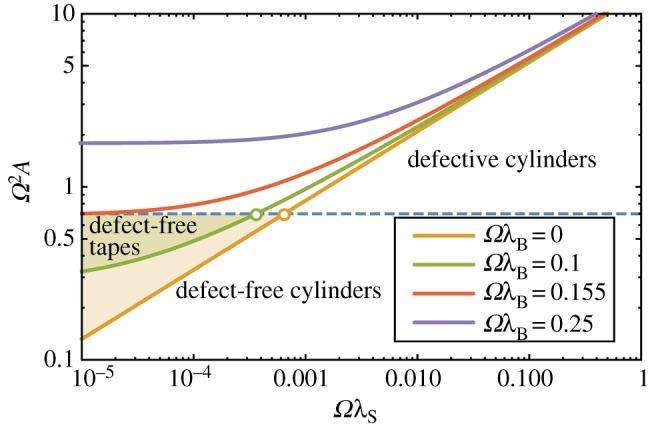
Figure 10.

Continuum theory (fixed-N/fixed-Ω) phase diagrams for morphology selection of twisted bundles for a range of values of ΩλB. Solid lines are predicted transition lines between defect-free cylinders and tapes, and dashed line is threshold stability for fivefold disclinations in cylinders. Equilibrium tapes are predicted in the shaded regions between the solid boundaries and dashed lines, with triple points indicated as empty circles. For ΩλB ≥ 0.155, tape morphologies are not stable.
