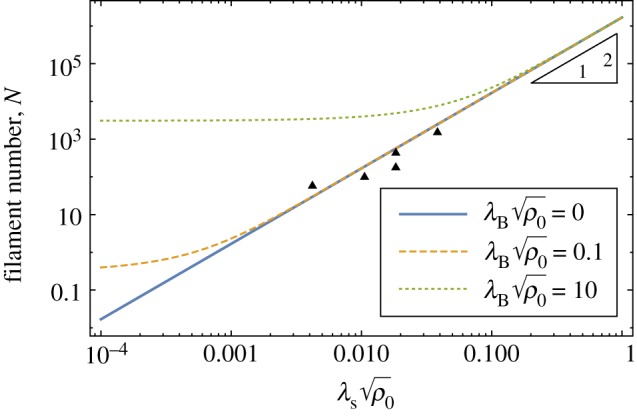
Figure 7.

Triple point relation between filament number N = Aρ0 and maximum  for which tapes are stable. The black triangles indicate results from N = 59, 101, 181, 440 and 1540 simulations where triple point
  was taken as the highest σ/d value at which a defect-free tape structure was found. Curves are predicted from continuum model where the defect-free cylinder/tape boundary (appendix A) crosses the critical threshold for fivefold defect stability in cylinders,
  .
.
