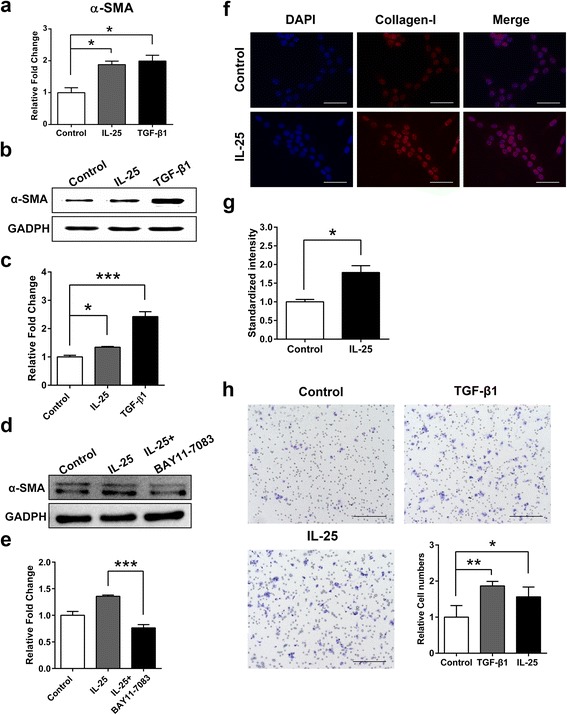
Fig. 3.

IL-25 facilitates LX-2 cells activation and migration. a LX-2 cells were stimulated with IL-25 (20 ng/ml) and TGF-β1 (5 ng/ml) for 24 h. Relative α-SMA expression was examined by quantitative real-time PCR. b LX-2 cells were stimulated with IL-25 (20 ng/ml) and TGF-β1 (5 ng/ml) for 24 h. α-SMA protein expression was detected by western blotting. GADPH was used as loading control. c Quantification of western blot data in (b). d LX-2 cells were stimulated with IL-25 (20 ng/ml) in the absence or presence of BAY 11–7083 (0.1 μg/ml) for 24 h. α-SMA protein expression was detected by western blotting. GADPH was used as loading control. e Quantification of western blot data in (d). f LX-2 cells were stimulated with IL-25 (20 ng/ml) for 24 h. Collagen-I protein expression was determined by immunofluorescence staining using Collagen-I antibody (red). Nuclei were stained with DAPI (blue). Original magnification ×200. g Quantification of immunofluorescence data in Fig. 3f. h LX-2 cells were stimulated with IL-25 (20 ng/ml) for 24 h. The migration was analyzed using a Transwell plate. Light microscopy was used to collect images of migrated cells. Original magnification ×100. The number of migration cells was counted as a mean of five independent fields for each experiment. PBS was used as negative control and TGF-β1 as the positive control. Data are shown as mean ± SEM. *P < 0.05, **P < 0.01, *** P < 0.001. Scale-bars: f, 100 μm; h, 200 μm
