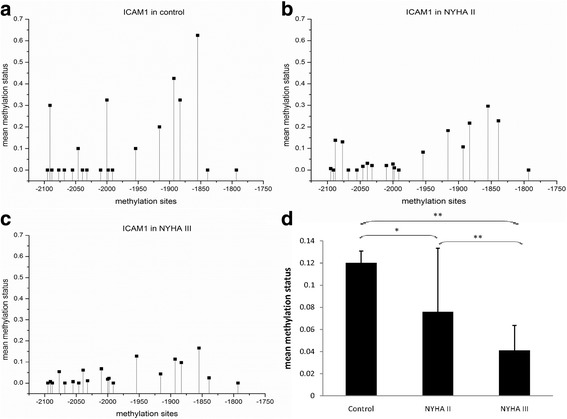
Fig. 2.

a, b and c Show the mean methylation status of each CG pairs in the promoter region of ICAM-1 gene in healthy control, NYHA IIgroup and NYHA III group respectively). Compared with healthy control, the promoter region methylation status with 20 CG pairs (−2095, −2091, −2088, −2077, −2068, −2055,-2046, −2039, −2032, −2010, −2000, −1998, −1991, −1954, −1916, −1893, −1883, −1855, −1839 and -1793 bp) of ICAM-1 gene were gradually decreased in NYHA II and NYHA III group. d, the average methylation level of CpG pairs in the region (−2138 to -1759 bp) of ICAM-1 promoter is gradually decreased in NYHA IIand NYHA III group compared to healthy control. (*, p < 0.05; **, p < 0.01)
