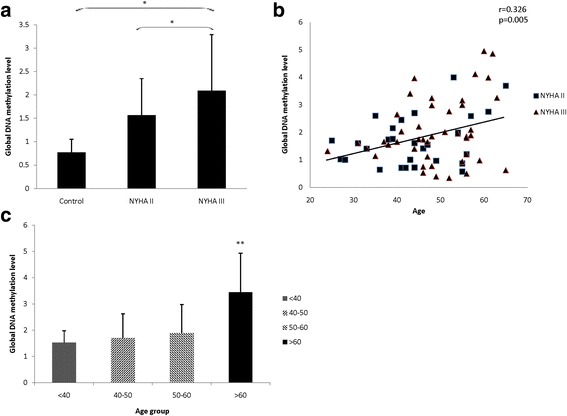
Fig. 3.

Global DNA methylation levels in different group and the correlation with age. a Shows the global DNA methylation levels of 3 group. Compared with healthy control and NYHA IIgroup, the global DNA methylation level is significantly higher in NYHA III group. b Shows the average global DNA hypermethylation status had positive correlation with age. c Shows the average global DNA methylation status was significantly higher in 60 years older group, compared with other three age groups.(*, p < 0.05; **, p < 0.01)
