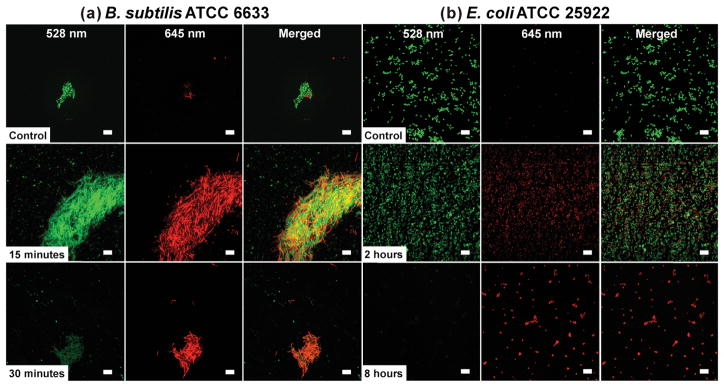
Figure 5.
Effect of TCNPs on the viability of a) B. subtilis ATCC 6633 and b) E. coli ATCC 25922, as monitored by confocal laser scanning microscopy. Representative images of control cultures (top row), and cultures treated with 1011 TCNPs (middle and bottom row) at the indicated time points. The green signal (SYTO 9) indicates viable live cells, whereas red signal (propidium iodide) indicates damaged or dead cells. Scale bars = 10 μm.

