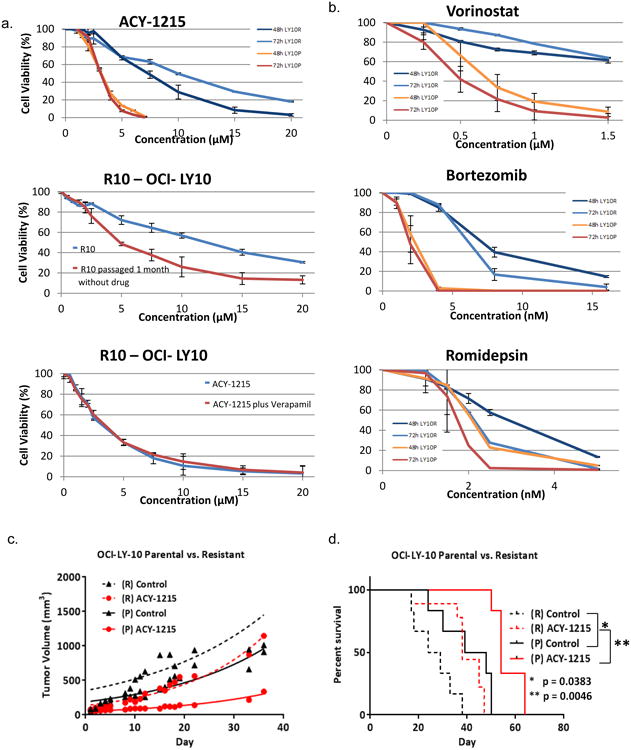
Figure 1. Development and Characterization of Selective HDAC6 Inhibitor Resistant Cell Line.

The DLBCL cell line, OCI-LY10 was exposed to increasing concentrations of ACY-1215 over time. (A) Concentration : effect relationships were established for resistant and parental Ly10 at 48 and 72 hours following exposure to ACY-1215. 48 hour concentration : effect relationship of increasing concentrations of ACY-1215 in the resistant line after immediate exposure and after a wash-out period of 1 month. Concentration : effect relationship was determined with ACY-1215 alone or in combination with verapamil 20 uM to inhibit efflux pumps. (B) Concentration : effect relationships were established for resistant and parental Ly10 at 48 and 72 hours following exposure to, vorinostat, bortezomib, and romidepsin. (C) SCID-beige mice were injected with LY10 107 in their flanks and treated with ACY-1215 50 mg/kg days 1-5, 8-12, 15-19 via the intraperitoneal route. (D) Kaplan-Meier Curve was calculated for the resistant control mice as compared to the resistant ACY-1215 mice, parental control and treatment cohorts
