
Figure 6. Pharmacokinetic and pharmacodynamics effects of ACY-1215 in combination with ibrutinib in mice.
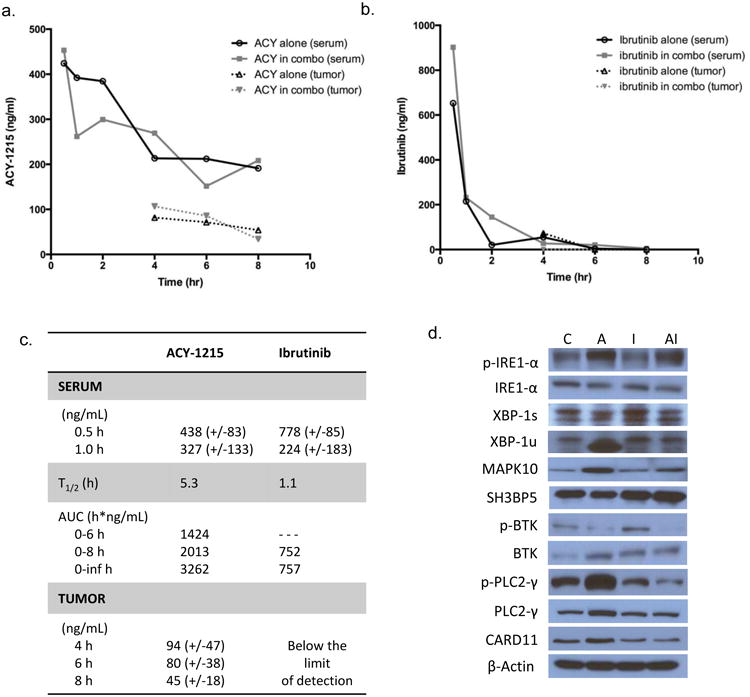
Serum and tumor tissue was collected from mice at sequential time points and analyzed for concentration of ACY-1215 and ibrutinib by LC-MS/MS. Mice were treated with ACY-1215 at 50 mg/kg alone and ACY-1215 50 mg/kg with ibrutinib 3 mg/kg. Drug concentrations are represented as mean values. (A) Graphical representation of ACY-1215 concentration over time. Mice received one dose of ACY-1215 50 mg/kg or ACY-1215 50 mg/kg plus ibrutinib 3 mg/kg for analysis of serum concentration of ACY-1215. For analysis of drug concentration in tumor tissue, ACY-1215 was administered at 50 mg/kg with or without ibrutinib. (B) Graphical representation of ibrutinib concentration over time analyzed in serum and tumor tissue. Mice received one dose of ibrutinib 3 mg/kg via i.p. route. (C) Summary of pharmacokinetic data for ACY-1215 and ibrutinib. (D) Immunoblot analysis of the IRE1 pathway of the UPR and the BTK pathway from whole cell lysates of mouse tumor tissue treated with ACY-1215, ibrutinib or the combination. Mice were treated with a single i.p. injection and analyzed at 6 hours.