
Figure 3.
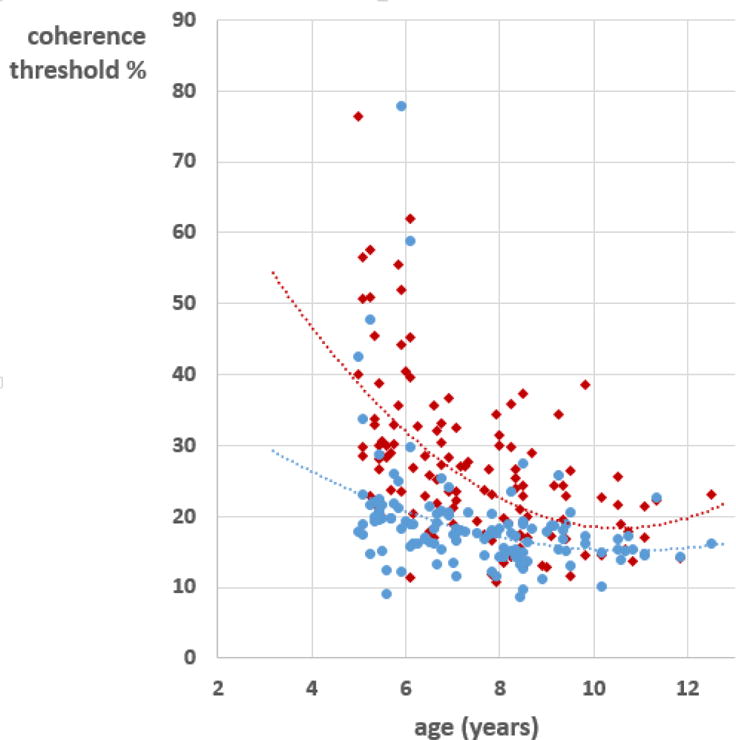
Individual children’s coherence thresholds for global motion (red) and global form (blue), plotted as a function of age. Each point is the mean of two measurements. The lines are quadratic fits to the data points. N = 125
Official websites use .gov
A
.gov website belongs to an official
government organization in the United States.
Secure .gov websites use HTTPS
A lock (
) or https:// means you've safely
connected to the .gov website. Share sensitive
information only on official, secure websites.
Individual children’s coherence thresholds for global motion (red) and global form (blue), plotted as a function of age. Each point is the mean of two measurements. The lines are quadratic fits to the data points. N = 125