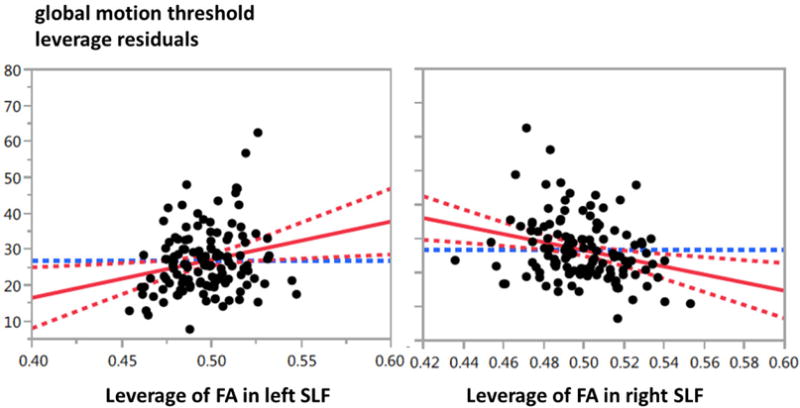
Figure 4.

Leverage plots of global motion thresholds against fractional anisotropy of the left and right superior longitudinal fasciculus. Leverage plots indicate the relationship between residuals when other variables in the model (age, age2, and gender) are allowed for.
