
Figure 5.
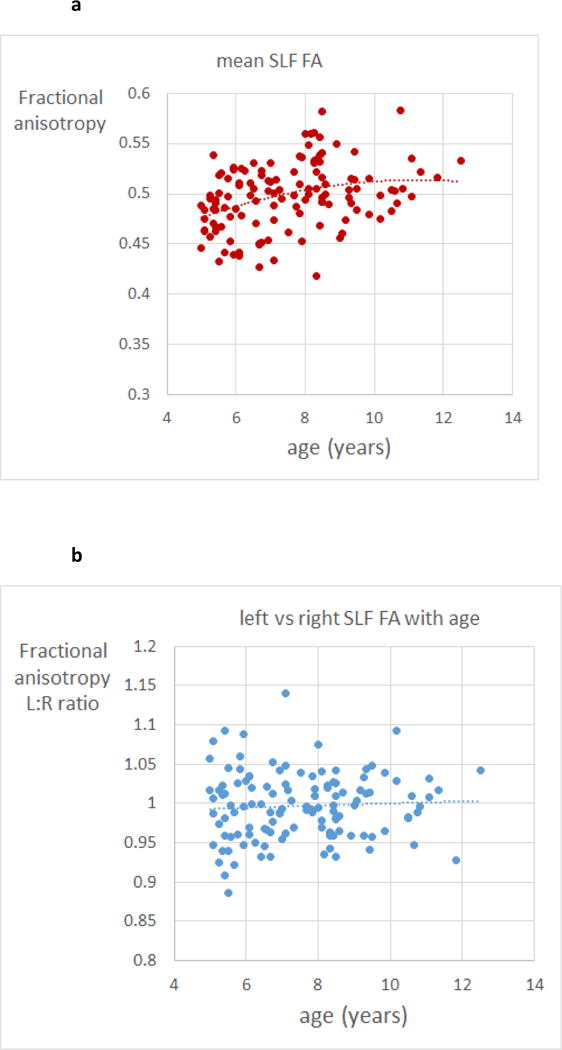
(a) scatter plot of mean fractional anisotropy of left and right superior longitudinal fasciculus for individual children, as a function of age. Dotted line is a quadratic fit (regression highly significant – see text); (b) scatter plot of the ratio of fractional anisotropy of left vs right superior longitudinal fasciculus for individual children, as a function of age. Dotted line is a quadratic fit (no significant age variation)