
Figure 6.
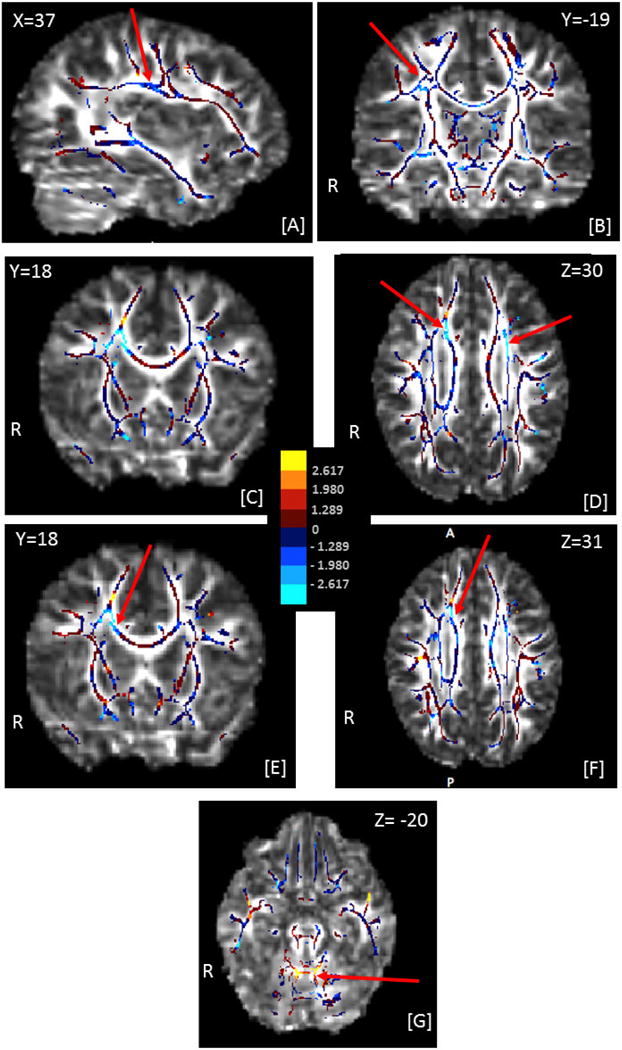
Effect-size maps of the associations between global thresholds and fractional ansiotropy (FA), adjusted for age, age2, and gender. The effect-size maps are overlaid on the target FA image. The center panel shows the mapping of colors to values of the t-statistics. All voxels on the skeleton are colored. |t| > 1.980 corresponds to an uncorrected p value of < 0.05, and |t| > 2.617 to p < 0.01. The MNI coordinates for each section are indicated on the image, along with R indicating the right hemisphere and A, P the anterior-posterior orientation of the axial section [F]. Red arrows indicate clusters of voxels discussed in section 3.3. Negative associations mean that high FA was associated with high sensitivity (low threshold).
[A]–[D] show effect sizes for the correlation of global motion thresholds with FA: [A], [B]: cluster of voxels in the right superior longitudinal fasciculus showing a negative association with motion coherence threshold; [C], [D]: clusters of voxels in right anterior and left superior corona radiata, showing a negative association with motion coherence thresholds
[E]–[G] show effect sizes for the correlation of global form thresholds with FA: [E], [F]: cluster of voxels in right anterior corona radiata showing a negative association with form coherence thresholds; [G] cluster of voxels in the cerebellum showing a positive association with form coherence thresholds.