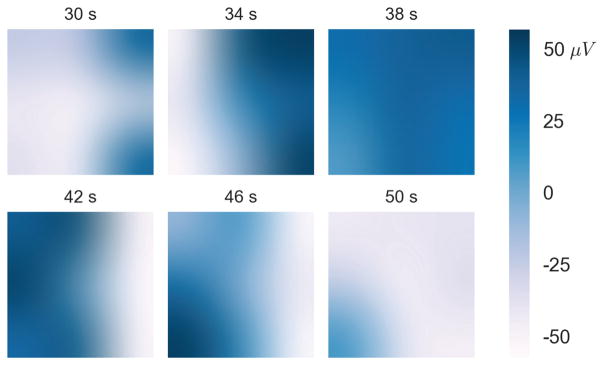
Fig. 6.
Individual time snapshots of the voltages for a 20 second segment from Subject 1. Voltage is presented in white-blue color (blue representing positive voltage) and time (in seconds) is labeled above each plot. The snapshots are interpolated for visualization purposes. This particular wave took approximately 20 seconds to propagate across the array at about 180 degrees relative to the positive x-axis.

