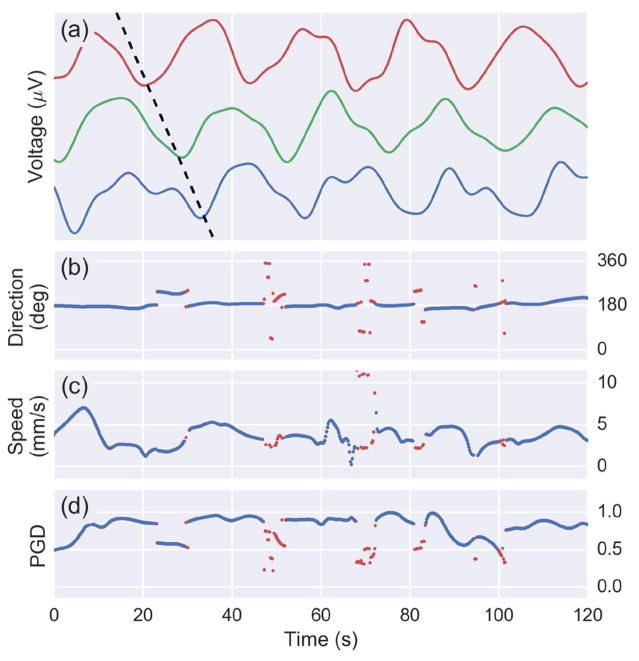
Fig. 7.
(a) Voltages of three channels from a 120 second segment of from Subject 1 data. Wave propagation observed by the phase delay between the channels is depicted by the black diagonal dotted line. A plot is shown the (b) direction, (c) speed, and (d) PGD as computed by the wave estimation algorithm at every time point. A PGD threshold is used to detect sustained waves (above 0.5 for at least 2 seconds). Blue indicates a sustained wave while red is used for points that do not meet the criteria.

