Fig. 9.
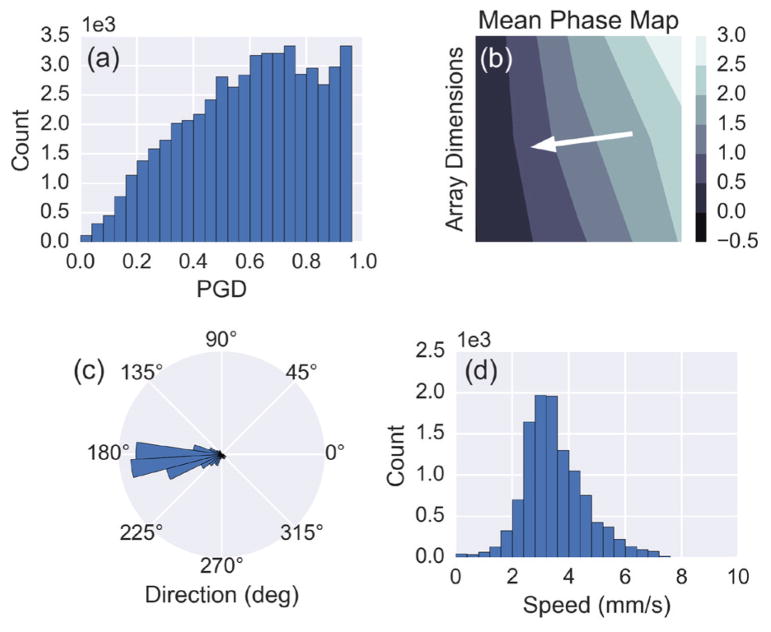
(a) A histogram of the PGD values from every time point throughout the recording for Subject 1. (b) The mean phase map, computed using the instantaneous phase for time points meeting the sustained wave criteria. The white arrow indicates the propagation direction of the waves based on the direction of the negative phase gradient. (c) Polar histogram showing the estimated direction of propagation for sustained waves. (d) Histogram of the estimated speed for sustained waves.

