
Figure 1. Ex vivo Immunoblot Analysis of Immunotherapy Treated Tumors.
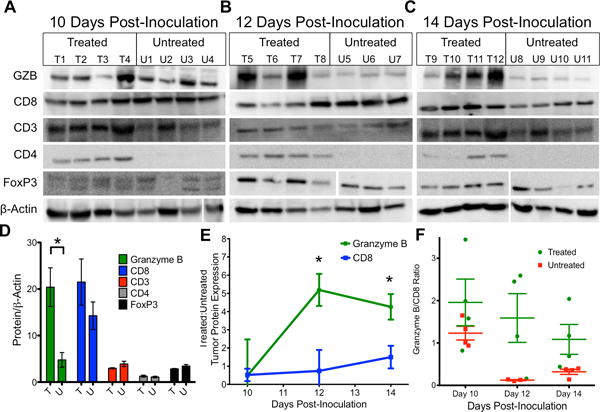
Western blot analysis of combination therapy and vehicle treated tumors on A) 10, B) 12 and C) 14 days post-inoculation. D) Quantification of protein expression on day 14 in treated (T) and untreated tumors (U). Bars represent the mean of 4 replicates ± SEM E) Ratio of treated to untreated expression of granzyme B and CD8 over time. Each point represents the mean of 3 or 4 mice with error bars representing SEM. * P < 0.05 by unpaired t test, significance is relative to expression. F) Ratio of granzyme B to CD8 for mice, each square represents a ratio for an individual mouse, with the mean ± SEM represented by bars.