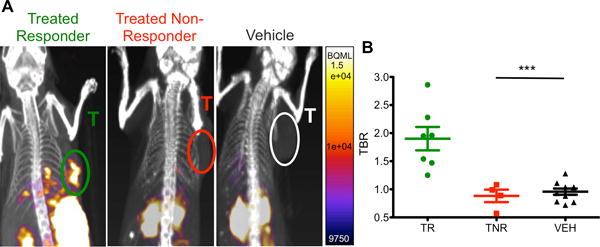
Figure 5. Granzyme B PET Imaging Differentiates Treated Responders and Non-Responders.

Mice treated with combination anti-PD-1 and anti-CTLA-4 therapy or vehicle were imaged 12 days post-inoculation. A) Representative sagittal images of treated responders, treated non-responders and vehicle treated mice, tumors labeled (T). B) Scatter plot of individual mice by groups, mean of each group are demonstrated by bars ± SEM. *** P < 0.001
