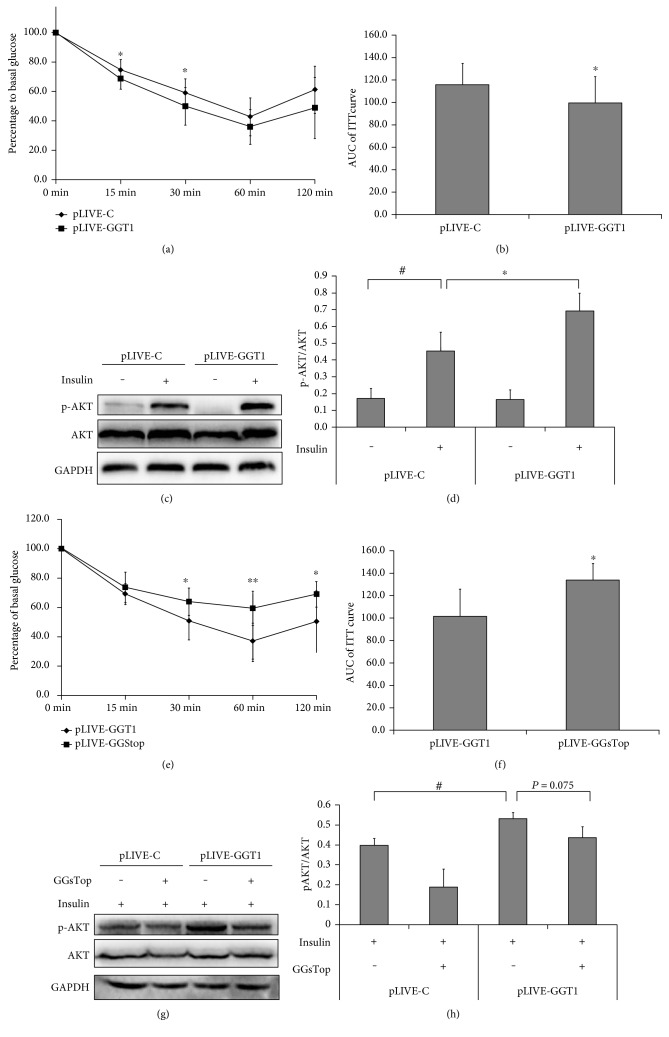
Figure 4.
Overexpression of GGT1 in the liver increased insulin sensitivity. (a) ITT was performed and the blood glucose was measured at the indicated time points (n = 13–17); (b) AUC of blood glucose after ITT. (c) The liver from fasted C57BL/6 mice injected with or without 0.75 U insulin/kg body weight for 15 min was subjected to Western blotting using a rabbit anti-phosphor-AKT (Ser473) polyclonal antibody or rabbit anti-total AKT polyclonal antibody. (d) Fold changes of phosphor-AKT versus total AKT relative to the basal levels in GGT1-L-OE and control mice were quantified by densitometry. (e) ITT was performed in GGT1-L-OE mice and GGT1-L-OE-sTop mice which were treated with GGsTop, a highly selective GGT inhibitor, and the AUC was counted (f). (g) Liver homogenates were immunoblotted with anti-phosphor-AKT (Ser473) antibody or anti-AKT antibody. (h) The relative expression of phosphor-AKT was presented by setting the mean density of blots. ∗P < 0.05, ∗∗P < 0.001, #< 0.05.

