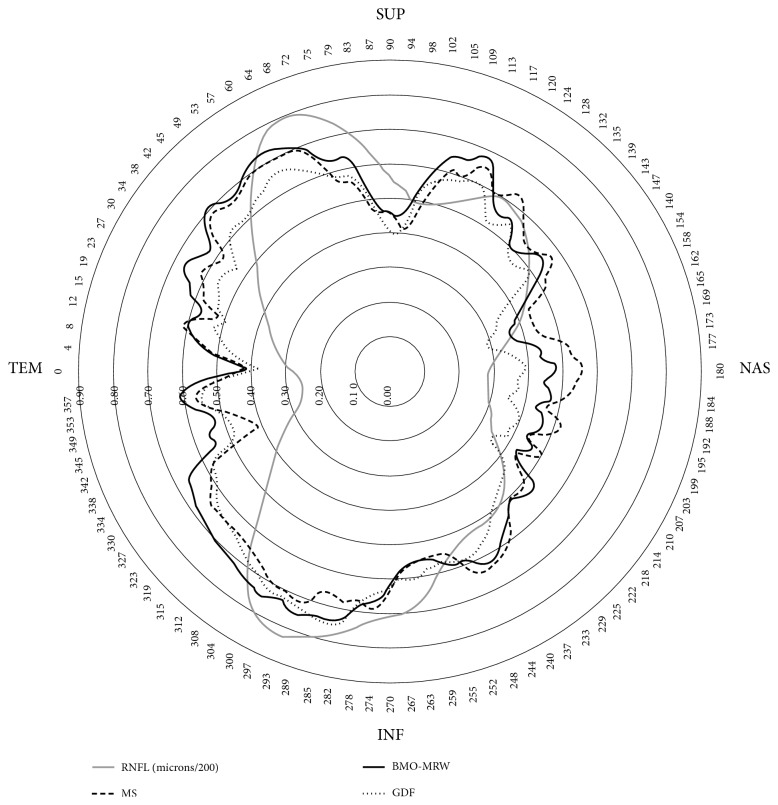
Figure 2.
The black lines represent the correlation coefficients (the greater the coefficients, the greater the radius) of perimetric mean sensitivity (MS), SPECTRALIS OCT BMO-MRW index, and the Laguna ONhE GDF index, with respect to the 768 RNFL thicknesses measured in 360 degrees. In gray, the RNFL thickness of normal control subjects (microns/200) has been superimposed.

