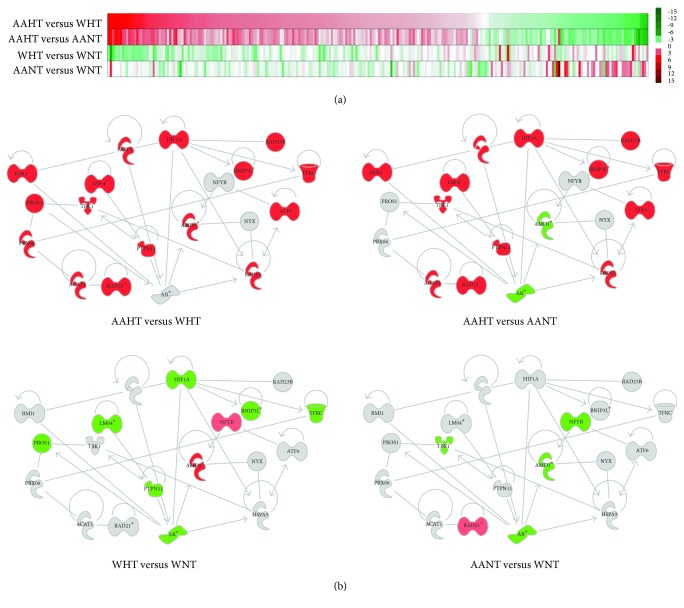
Figure 1.
Pathway analysis of gene expression in hypertensive women. (a) Heat map of significantly changed genes identified from top canonical and physiological pathways and functions in HAECs after overexpression of miR-103a-20-5p and miR-585-5p miRNA mimics. Red (up) and green (down) indicate relative Z-ratios of significantly and-differentially expressed mRNAs in PBMCs from our hypertension cohort and reflect changes in AAHT compared with WHT or AANT, WHT with WNT, and AANT with WNT. (b) IPA-curated, hierarchal clustering of functional relationships between individual genes predicted to be targets of either miR-103a-2-5 or miR-585-5p. Red (up) and green (down) indicate relative fold change of significantly and differentially expressed mRNAs in PBMCs from our hypertension cohort in each comparison. AAHT: AA hypertensives; AANT: AA normotensives; WHT: white hypertensives; WNT: white normotensives.

