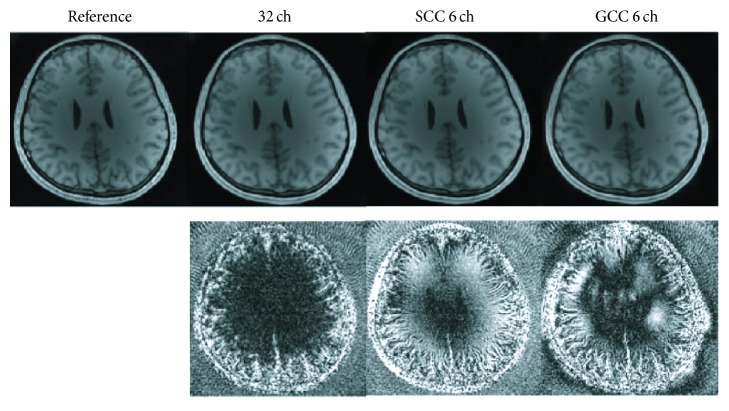
Figure 3.
Comparison of SCC and GCC for simulation results with acceleration factor of 2 in angle direction. SSOS images are compared. The original image in the first column is used as the reference. The compression results of SCC and GCC with 6 virtual coils are shown in the third and fourth column, respectively. Difference maps (10x in SCC and GCC) are shown in the second row. The k-space trajectory is in linear-angle pattern. (The images and the difference maps are displayed in the same gray scale range, resp.; and Figures 5, 6, 8, and 10 are as well.)

