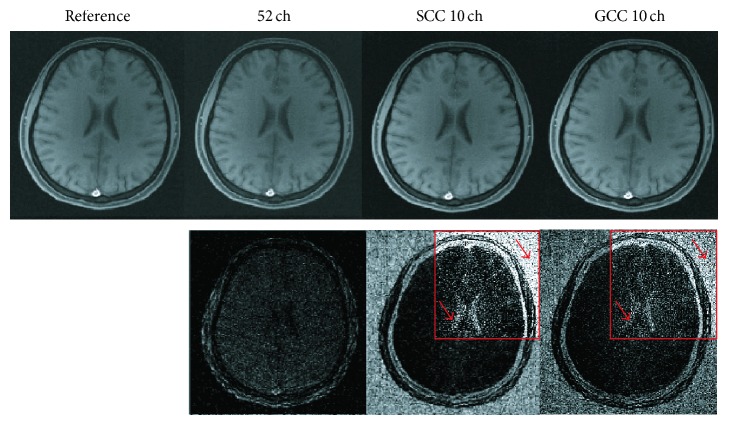
Figure 6.
Comparison of SCC and GCC results for in vivo undersampled 300 spokes' data. SSOS images are compared. The original image in the first column is used as the reference. The compression results of SCC and GCC with 10 virtual coils are shown in the third and fourth column, respectively. Difference maps (4x enlarged view in red box) are shown in the second row. The k-space trajectory is in golden-angle pattern. The reconstructions of the undersampled data are performed by SPIRiT.

