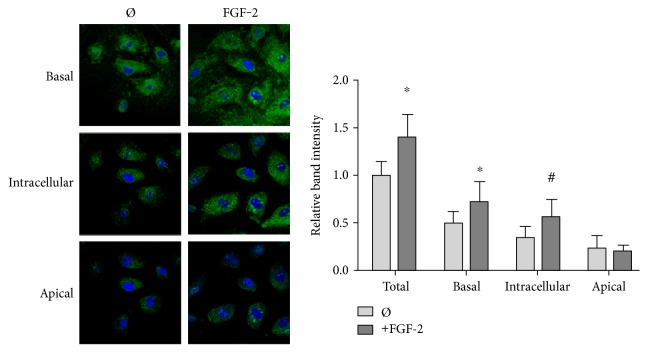
Figure 4.
FGF-2 stimulation increased basal and intracellular vitronectin. Confocal microscopy images of cells labeled for vitronectin (AF488, green) and nuclei with (Hoescht, blue). HUVEC treated with 50 ng/ml FGF-2 for 24 hours were permeabilized with Triton X-100 to label membrane and cytoplasmic vitronectin. Samples were imaged in a z-stack (1 μm depth, 12 images per sample) to obtain fluorescence intensity throughout the cell. Images in the z-stack were classified as basal (below the nucleus), intracellular (at the same levels as the nucleus), and apical (above the nucleus). Mean intensity values were quantified with ImageJ. All samples were normalized to total vitronectin in untreated cells. #p < 0.05 versus that of the untreated cells. n = 3, one representative experiment of three.

