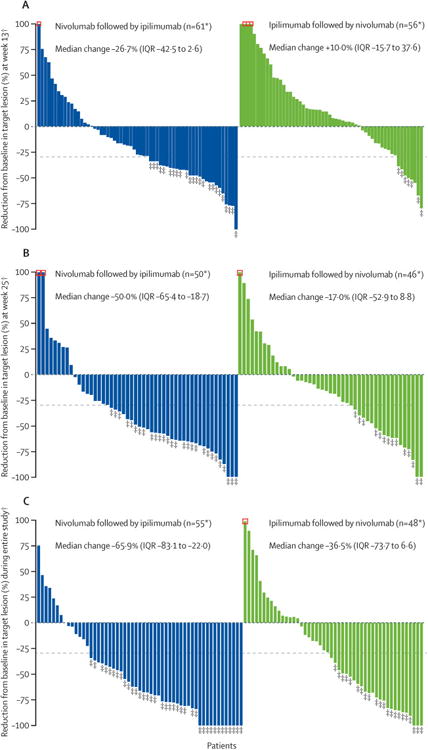
Figure 3. Tumour burden change from baseline (A) at week 13 and (B) at week 25, and (C) best tumour burden change during the entire study period.

*Patients with target lesion at baseline and at least one tumour assessment (A) at week 13 or (B) at week 25 or (C) on treatment. †Negative/positive value means maximum tumour reduction/minimum tumour increase. Reduction is based on evaluable target lesion measurements up to the start of subsequent therapy. Horizontal dotted reference line indicates the 30% reduction consistent with a Response Evaluation Criteria in Solid Tumors version 1.1 response. ‡Responders (A) at week 13 or (B) at week 25 or (C) during the entire study period. Square symbol represents percentage change truncated to 100%.
