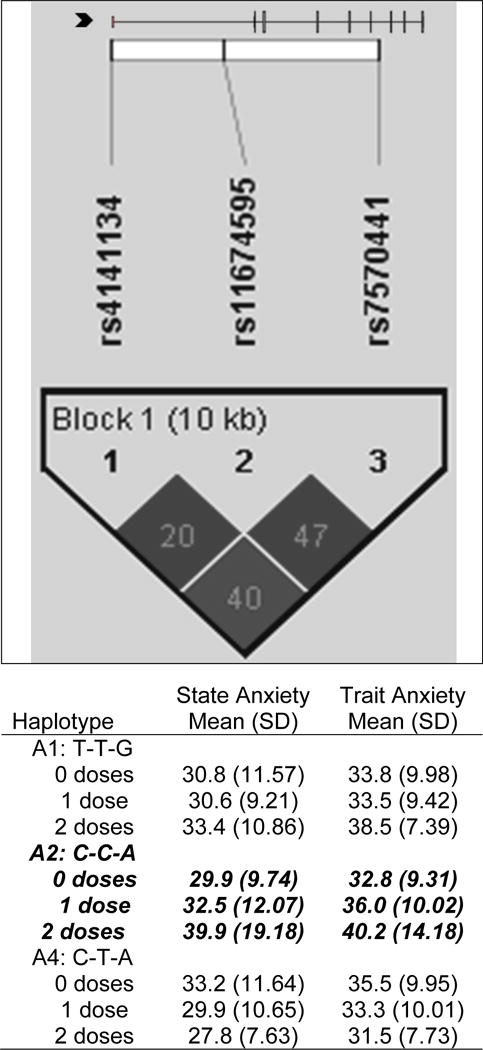
Figure 2.

IL1R2 linkage disequilibrium-based heatmap and haplotype analysis. In the figure embedded in the top row of the table, an ideogram of interleukin 1 receptor 2 (IL1R2) is presented above the white bar that represents the physical distance along human chromosome 2 (position 31, 96,370,336 to 96,380,807; genome build 36.3, contig NT_022171.14). Exons are represented as tick marks. Gray lines connecting the exons represent introns. The black chevron indicates the direction of gene transcription. Reference sequence identifiers (rsID) for each single nucleotide polymorphism (SNP) are plotted both in terms of their physical distance (i.e., the white bar at the top of the figure) and also equidistantly to render the pairwise linkage disequilibrium (LD) estimates that were calculated and visualized with Haploview 4.2. The gene structure for IL1R2 (i.e., reference sequence NM_004633) was rendered with FancyGene 1.4. The correlation statistics (r2 and D’) are provided in the heatmap. LD-based haplotype block definition was based on the D’ confidence interval method. The haploblock is indicated in a bolded triangle and its component SNPs are rendered in bold font. Pairwise D’ values (range: 0-1, inclusive) were rendered in grey, with darker grey diamonds representing D’ values approaching 1.0. When the r2 values (range of 0–100, inclusive) are not equal to 0 or 100, they are provided in a given diamond. The haplotypes observed in the haploblock are listed in each row, starting with the nucleotide composition across the two SNPs that compose the haplotype (i.e., rs4141134, rs11674595, rs7570441) and both the mean and standard deviation (SD) for trait and state anxiety for each of the three subgroups for a given haplotype (i.e., zero doses of the haplotype, one dose of the haplotype, two doses of the haplotype). The C-C-A haplotype (i.e., IL1R2 HapA2) identified in the bivariate analyses (Supplemental Table 1) that remained significant after controlling for relevant confounders is rendered in bold and italicized.
