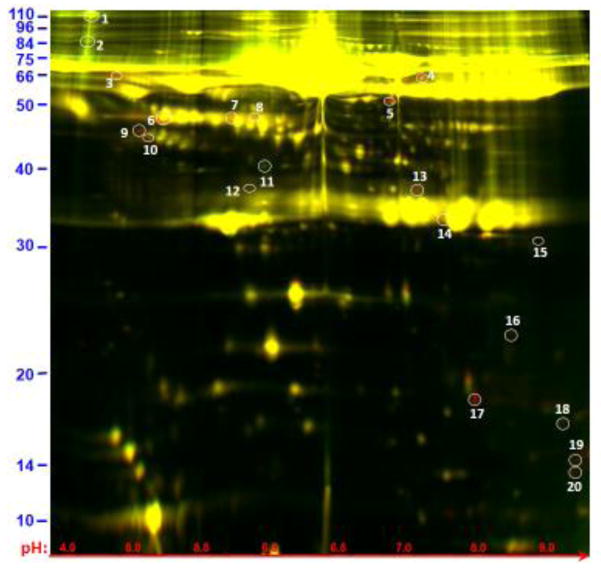
Figure 1.
Image showing 2D gel resolution of samples obtained following normal human serum incubation for 1 hour at 37°C either in the presence of schistosome parasites (red) or without parasites (green). Most proteins are the same in both samples and appear yellow. The protein spots selected for analysis here are circled and numbered. Three exhibit greater relative abundance in the absence of parasites (green spots 1, 2, 11); the remaining proteins are more abundant in the presence of parasites. Spots 1–20 were recovered and analyzed using mass spectroscopy and their identities are listed in table 1. The numbers in blue (left) represent molecular mass (kDa) and in red (bottom) represent pH value.

