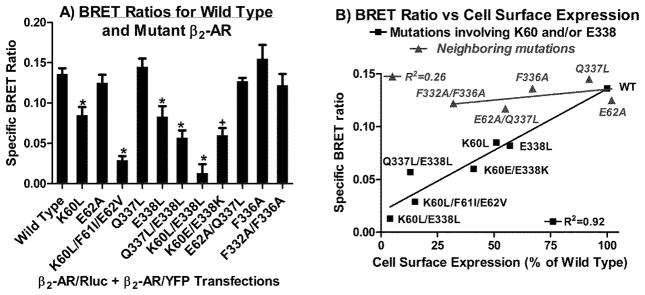
Figure 6.
A) BRET measured in transfected HEK293 cells. The β2-AR/Rluc+5-HT2C/YFP pair was used to define non-specific BRET as 0.065 (determined in figure 4), which was subtracted from BRET ratios obtained with the indicated Rluc+YFP pairs to obtain the “specific” BRET ratios plotted on the Y-axis. Data represent the mean+/-sem from three to five experiments. Student’s t-test *p<0.01 vs Wild Type; +p<0.05 for K60E/E338K vs K60L/E338L. B) BRET ratio vs cell surface expression. The specific BRET ratios from figure 6A were plotted on the Y-axis and cell surface expression levels from the whole cell radioligand binding assay in figure 3A were plotted on the X-axis.

