FIGURE 4.

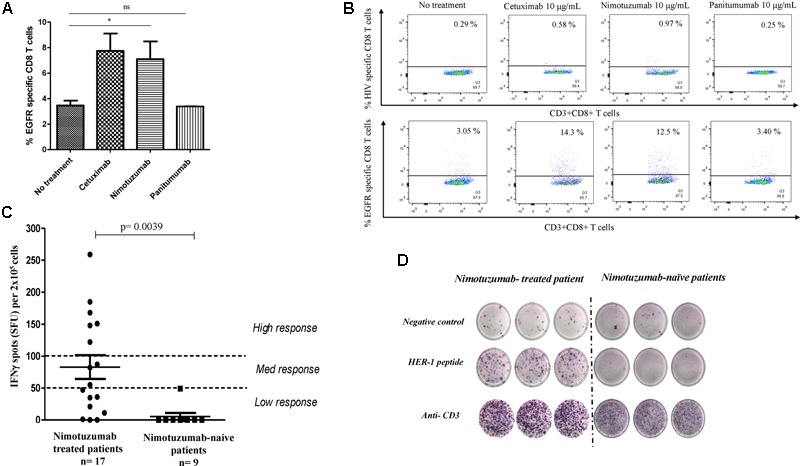
Enhancement by nimotuzumab of IFNγ-secreting EGFR-specific T cells in vitro and in vivo. (A) Purified CD8+ T cells from HLA-A2 healthy donor were stimulated with autologous DC fed with irradiated PCI-15B HNSCC cells (EGFR+ HLA-A2-) coated with nimotuzumab or cetuximab or panitumumab (each at 10 μg/mL) with autologous NK cells (DC:NK:PCI-15B at 1:1:1 ratio). The bar diagram represents the frequency of EGFR853-861-specific CD8+ T cells measured by EGFR853-861 HLA-A2 tetramer. A significant increase of specific T cells was obtained when the cells were incubated with nimotuzumab or cetuximab (10 μg/mL) in comparison with cells incubated with panitumumab (10 μg/mL) or without treatment (∗p < 0.05). Data are representative of five individual experiments. A two-tailed unpaired t-test was conducted for statistical analysis. (B) Dot plot of EGFR-specific CD8+ T cells measured by EGFR853-861HLA-A2 tetramer from one representative donor is shown. HIV peptide HLA-A2 tetramer was used as negative control. (C) Peripheral blood mononuclear cells (PBMC) were stimulated with a pool of peptides (See “Materials and Methods”) from EGFR and IFNγ-producing T cells in response to stimulation was tested by ELISpot assay. Cells were seeded and analyses performed in triplicates. As negative control no peptide was used. For positive control anti-CD3 mAb was used. Responses were considered positive if 10 or more specific spots were detected and if the number of spots in the presence of an antigen was at least twofold that in its absence. Responses were arbitrarily classified as a low response if the spots were in the range 0–50 spots, medium response if the spots were between 51 and 99 spots and a high response above 100 spots. Higher number of specific T cells in nimotuzumab-treated patients (n = 17, 14 HNSCC patients and 3 with other tumor localizations) compared with nimotuzumab-naïve HNSCC patients (n = 9) was found. Wilcoxon matched paired test was used as statistical analysis. (D) Display result from representative nimotuzumab-treated and nimotuzumab-naive HNSCC patients.
