
Figure 3.
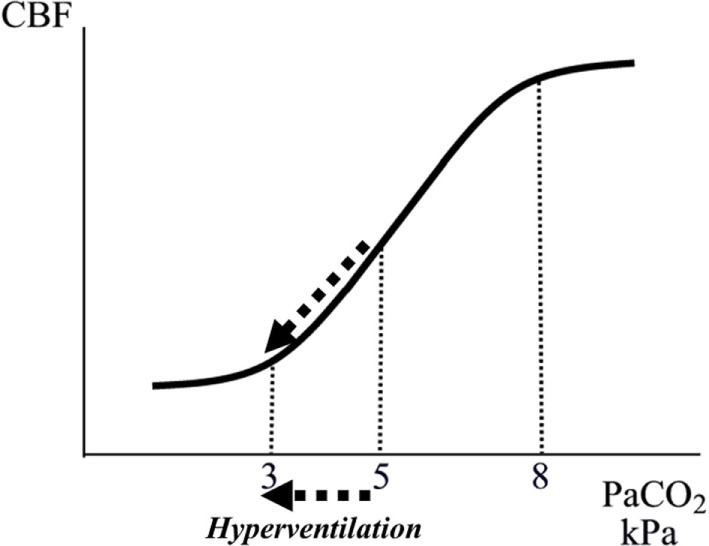
Schematic illustration of the relation between arterial tension of CO2 (PaCO2) and cerebral blood flow (CBF). The interrupted arrows indicate the decrease in CBF during a decrease in PaCO2 due to hyperventilation.
Official websites use .gov
A
.gov website belongs to an official
government organization in the United States.
Secure .gov websites use HTTPS
A lock (
) or https:// means you've safely
connected to the .gov website. Share sensitive
information only on official, secure websites.
Schematic illustration of the relation between arterial tension of CO2 (PaCO2) and cerebral blood flow (CBF). The interrupted arrows indicate the decrease in CBF during a decrease in PaCO2 due to hyperventilation.