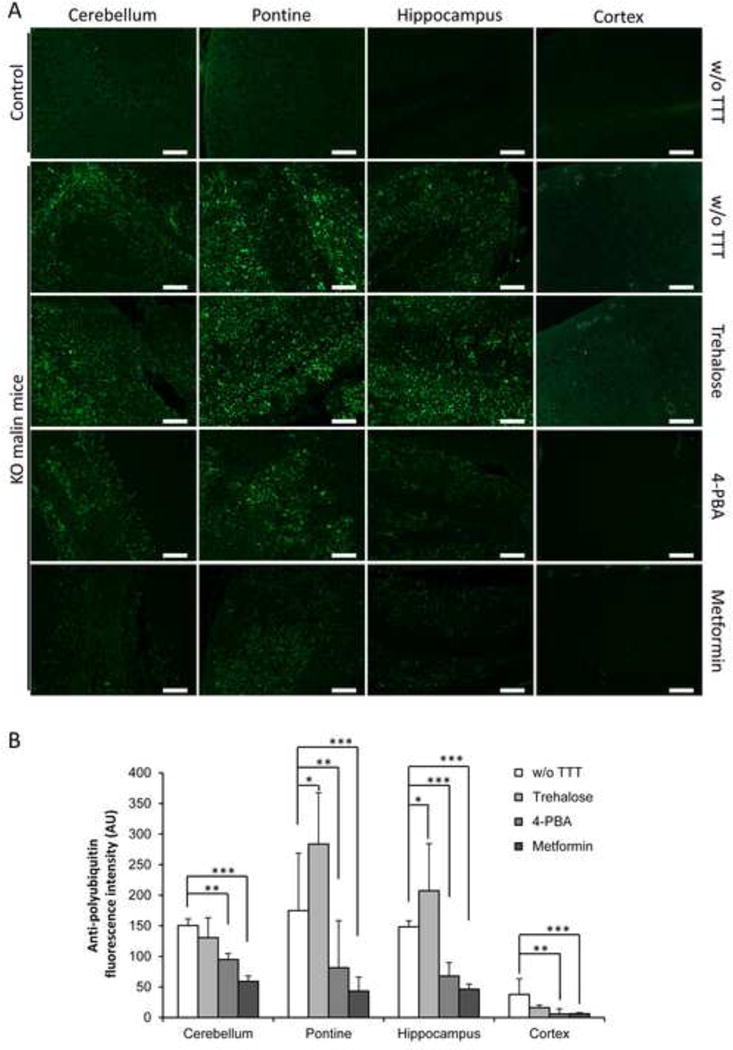
Figure 3.

Immunohistofluorescence analyses of polyubiquitinated protein aggregates in brain of Epm2b+/− (control) or Epm2b−/− (KO) mice untreated (w/o TTT) or treated with trehalose, 4-PBA or metformin (two months). (A) Representative frontal sections of the cerebellum, pontine, hippocampus and cortex from Epm2b+/− control or Epm2b−/− KO mice untreated (w/o TTT) or treated as indicated, were incubated with anti-polyubiquitin antibody and AlexaFluor488 conjugated anti-rabbit antibody. Scale bars: 100 μm. (B) Polyubiquitin-associated fluorescence was quantified with ImageJ software in two independent pictures of cerebellum, pontine, hippocampus and cerebral cortex from five mice per group, and mean fluorescence in an area of 0.4 mm2 was represented. Bars indicate mean of fluorescence values corresponding to five mice ± SEM. Asterisks denote significant differences *p< 0.05, **p< 0.01, ***p<0.001 comparing the indicated groups with the basal condition (Epm2b−/− w/o TTT) according to Kruskal-Wallis non-parametric test followed by Conover-Inman post-hoc test.
