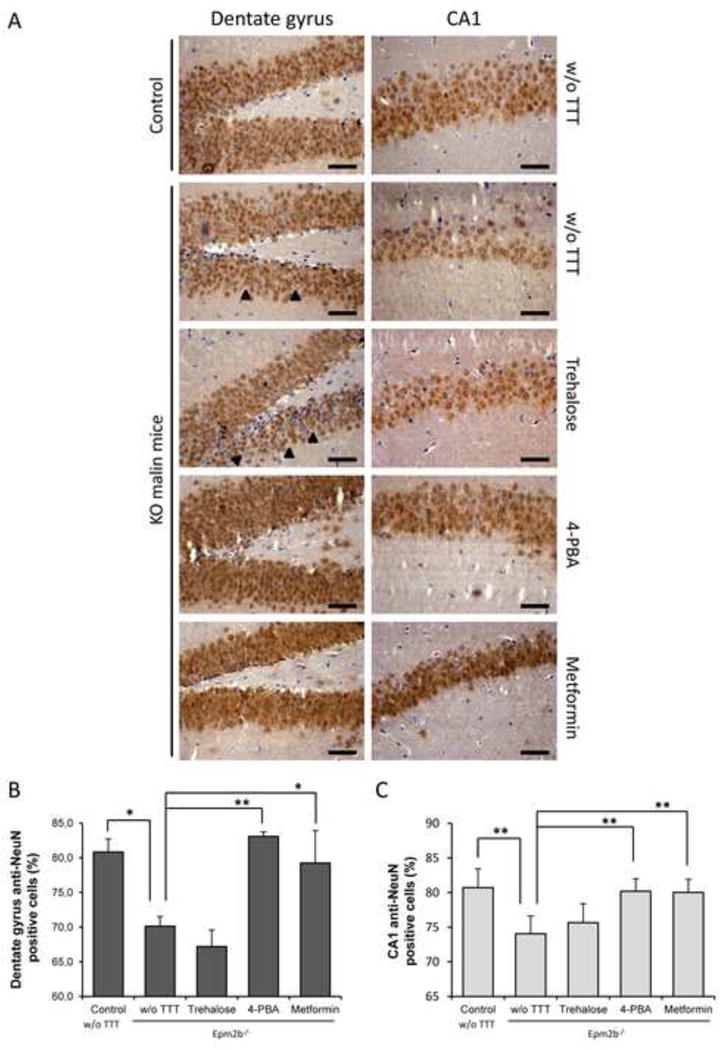
Figure 4.

Immunohistochemistry analyses of neurodegeneration in hippocampus of Epm2b+/− (control) and Epm2b−/− (KO) mice untreated (w/o TTT) or treated with trehalose, 4-PBA or metformin (two months). (A) Representative frontal sections of the dentate gyrus (DG) and the cornus ammonis 1 (CA1) of the hippocampus from Epm2b+/− control or Epm2b−/− KO mice untreated (w/o TTT) or treated as indicated, were incubated with anti-NeuN (Neuronal nuclei) antibody. Black arrow heads point to empty space between neurons in DG. Scale bars 25 μm. NeuN-positive and negative cells were counted in DG (B) and CA1 (C) sections from three independent mice and percentage of NeuN-postive cells in an area of 0.09 mm2 was represented. Bars indicate mean values corresponding to three independent mice ± SEM. Asterisks denote significant differences *p< 0.05 **p<0.01 comparing the indicated groups with the basal condition (Epm2b−/− w/o TTT) according to Kruskal-Wallis non-parametric test followed by Conover-Inman post-hoc test.
