FIGURE 1.

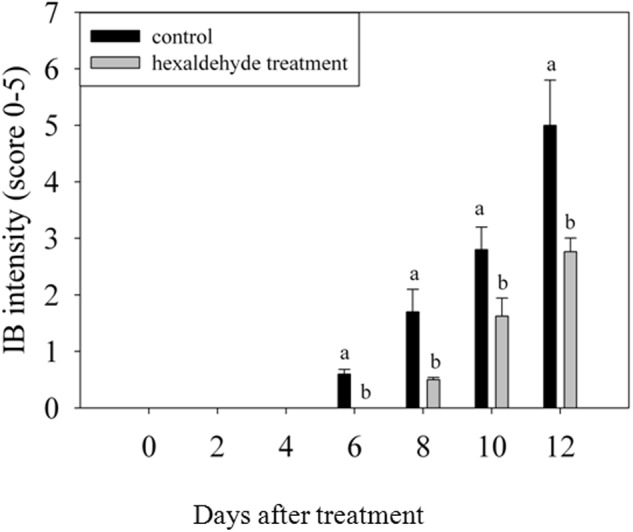
Changes in IB intensity of fruits treated with hexaldehyde. Each value represents the mean ± standard error of three replicates.

Changes in IB intensity of fruits treated with hexaldehyde. Each value represents the mean ± standard error of three replicates.