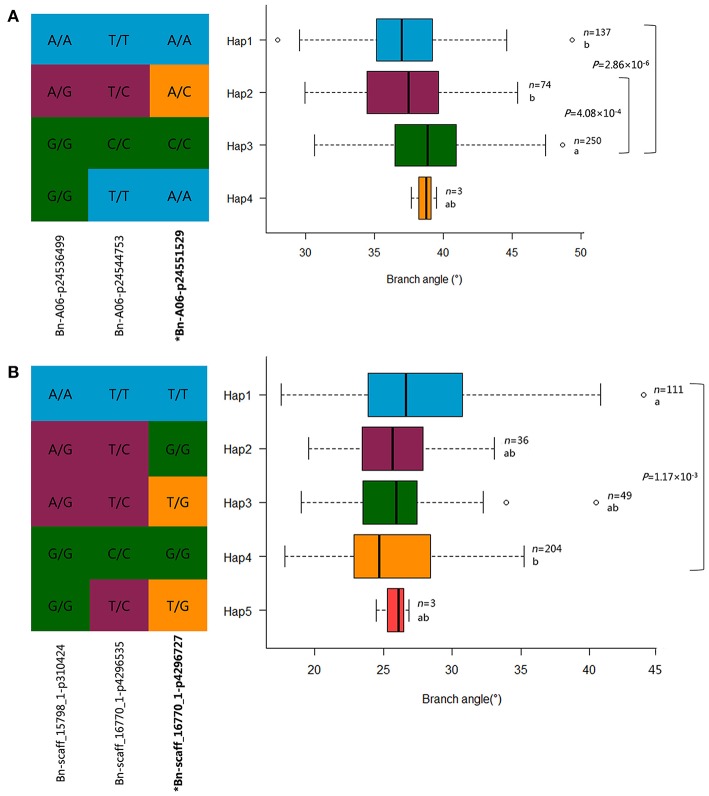
Figure 7.
Haplotypes of associated SNPs among rapeseed natural variations. (A) Haplotype analysis of the peak SNP Bn-A06-p24551529 for Bna.SGR3 in MLM. (B) Haplotype analysis of the peak SNP Bn-scaff_16770_1-p4296727 for Bna.SGR1 in MLM. n denotes the number of genotypes belonging to each haplotype group, and the genotypes less than three are not shown. Statistical significance was determined with a t-test, different letters represent significant a difference at 5% level. The branch angle distribution of each haplotype group is displayed with a box plot.

