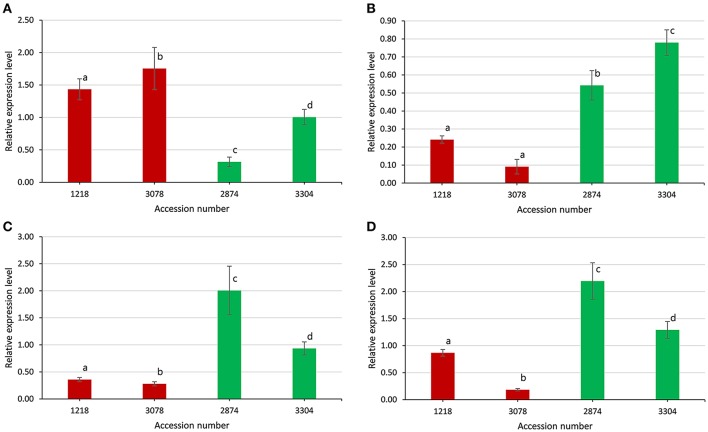
Figure 8.
Expression levels of four candidate genes between extremely large and small branch angle accessions. (A) Bna.TAC1. (B) Bna.SGR1. (C) Bna.SGR3. (D) Bna.SGR5. Error bars, s.d.; statistical significance was determined with a t-test, different letters above the bar represent significant a difference at 5% level.

