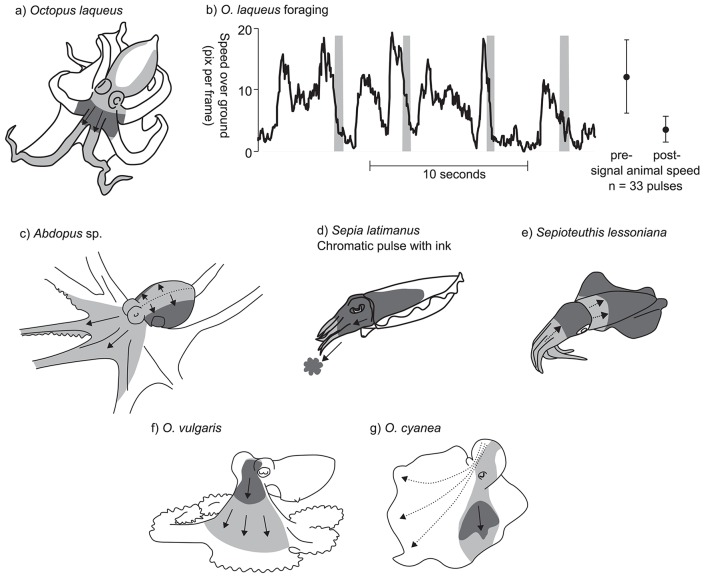
Figure 3.
Examples of chromatic pulse patterns. In panels (a) and (c–g), light gray indicates the sweep area of the chromatic pulse, and dark gray indicate the position of the pulse at a fixed point in time. (a) Octopus laqueus. (b) Timing of chromatic pulse during O. laqueus foraging. Graph presents a subsection of 33 chromatic pulses recorded in a continuous video sequence. Gray bars indicate pulse timing; black line indicates approximate speed over ground of the foraging octopus. Subsequent data points and error bars indicate mean speed ± SD prior to display and after each display is finished. (c) Abdopus sp. Dotted line indicates line of chromatic pulse origin. (d) S. latimanus chromatic pulse with coordinated ink jet. (e) Sepioteuthis lessoniana. (f) O. vulgaris (redrawn from Packard and Sanders, 1971). (g) O. cyanea (redrawn from Mather and Mather, 2004). Dotted arrows indicate alternative possible routes for the chromatic patch.

