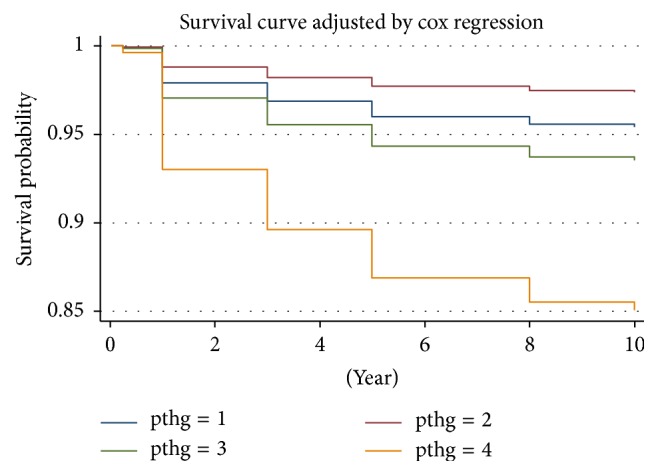
Figure 3.

Cox proportional hazards regression model survival curves. Note: pthg = 1: A: iPTH ≤ 20 pg/mL; pthg = 2: B: iPTH 21–150 pg/mL; pthg = 3: C: iPTH 151–600 pg/mL; pthg = 4: D: iPTH > 600 pg/mL. Adjusted for age, gender, dialysis vintage, primary cause of end-stage renal disease, serum Caalb, P, and ALP.
