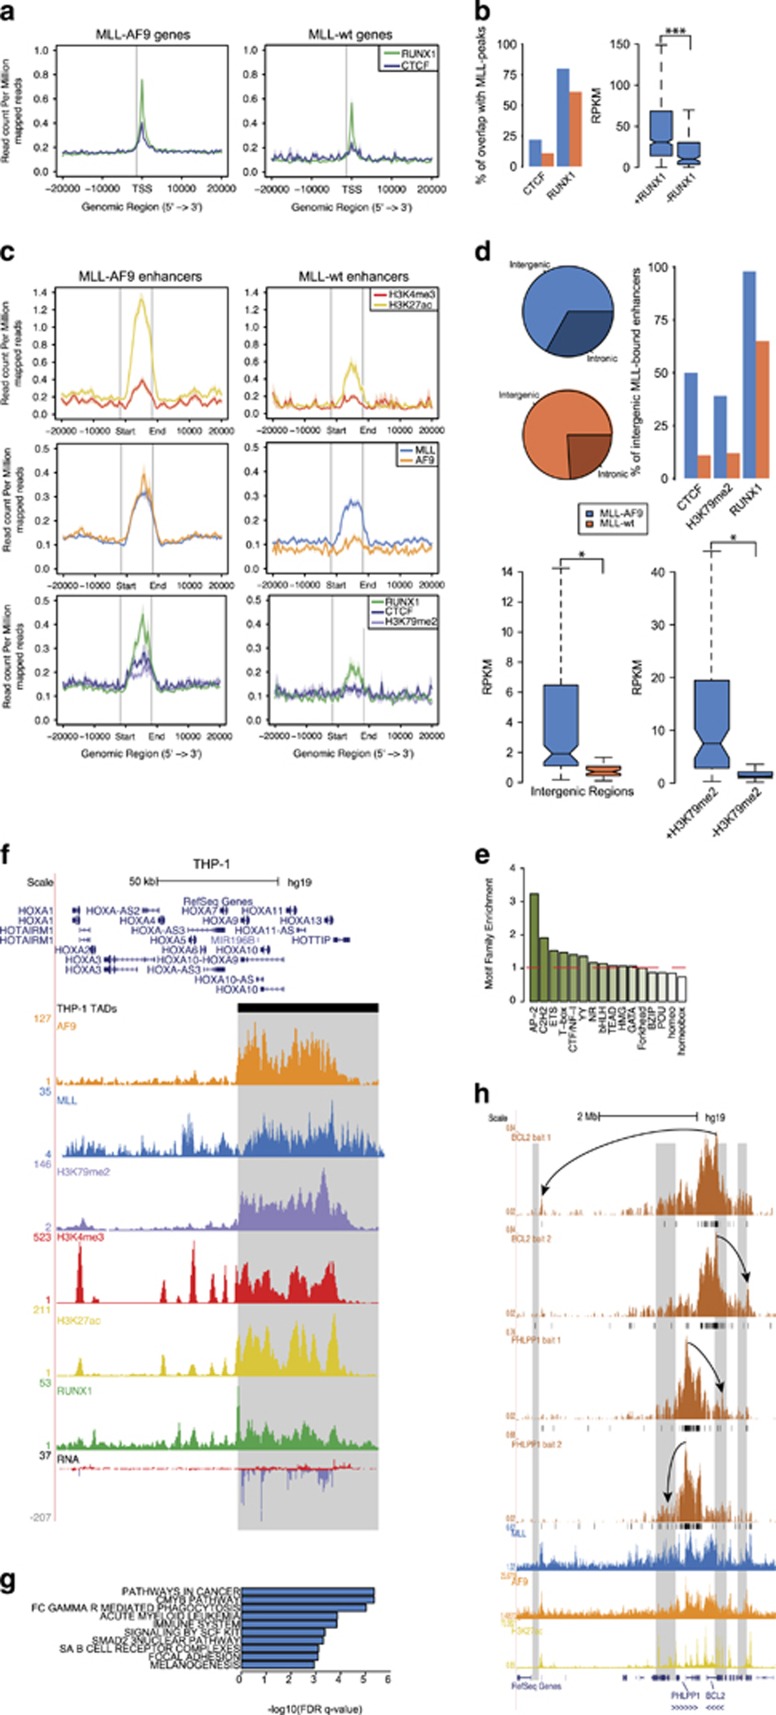
Figure 4.
Characterization of MLL-AF9-bound distal regulatory elements. (a) Average signal of RUNX1 and CTCF on MLL-AF9 and MLL WT target genes. (b) Rate of co-occupancy of MLL-AF9 and MLL WT target genes by RUNX1 and CTCF (left). Expression level of MLL-AF9 target genes grouped by RUNX1 co-occupancy. ***P<0.001 (Welch’s t-test) (right). (c) Average signal on MLL-AF9 (left) and MLL WT (right) bound enhancers for H3K4me3 and H3K27ac (top), MLL and AF9 (middle) and RUNX1, CTCF and H3K79me2 (bottom). (d) Genomic distribution of MLL-AF9 and MLL WT enhancers (top left). Co-occupancy of MLL-AF9 and MLL WT bound enhancers by CTCF, H3K79me2 and RUNX1 z(top right). Expression levels of MLL-AF9 and MLL WT intergenic enhancers (bottom left). Expression level of MLL-AF9-bound enhancers grouped by H3K79me2 co-occupancy. *P<0.05 (Welch’s t-test). (e) Motif family enrichment for MLL-AF9-bound enhancers. (f) Overview of HOXA locus in THP-1 cells showing alignment of AF9, MLL, H3K79me2, H3K4me3, H3K27ac, RUNX1 and RNA expression signal with the HOXA TAD boundary (gray box). (g) Pathway enrichments of active genes nearest to an MLL-AF9-bound enhancer within the same TAD. (h) Long range interactions from the BCL2 and PHLPP1 promoters as measured by 4C-seq in THP-1 cells (black bars, q<0.01) aligned with MLL, AF9 and H3K27ac ChIP-seq patterns on MLL-AF9-bound enhancers (gray boxes). Arrows highlight examples of interactions of the baited promoters with MLL-AF9-bound enhancers.

