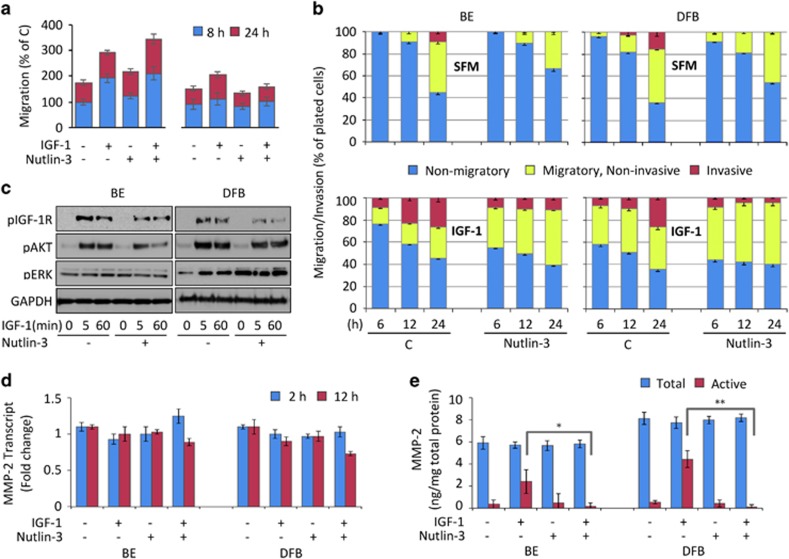
Figure 7.
Effect of Nutlin-3 on IGF-1R-dependent melanoma migration and invasion. (a) Effect of Nutlin-3 on wound closure migration. A wound made in confluent monolayer of melanoma cells was treated with or without 1 μM Nutlin-3 for 8 h followed by IGF-1 stimulation for the indicated times. The rates of wound closure migration are displayed relative to the untreated cells control (C) as the mean±s.e.m. from three independent experiments. (b–e) Effect of Nutlin-3-induced unbalanced IGF-1R signaling on migratory and invasive phenotype of the melanoma cells. Cells were treated with or without 1 μM Nutlin-3 for 12 h in serum-containing media to initiate IGF-1R downregulation. The Nutlin-3 effect on unbalanced response to IGF-1 was verified by WB testing the levels of p-IGF-1R, p-AKT, p-ERK and GAPDH as a loading control in lysates from the cells that were serum starved for 3 h before IGF-1 stimulation (c). Parallel samples pretreated with Nutlin-3 were fluorescently labeled with Dilc12 and then plated on the top of the transwell migration chambers, without (migration) or with (invasion) a layer of 5% Matrigel using 15% serum as a chemoattractant in the lower chamber and stimulated or not with IGF-1 in the top chamber. Bottom fluorescence of migrated/invaded cells was read at 6, 12 and 24 h time points and displayed as a percentage of the total number of the cells plated on the top chamber at time 0 (b). Cells treated as in panels (b and c) were used to evaluate the effects of Nutlin-3 on MMP-2 transcript expression by qRT-PCR (d) and to measure total and endogenously activated MMP-2 levels secreted in the culture media by enzyme-linked immunosorbent assay (e). MMP-2 transcript levels are normalized to GAPDH and displayed as a mean fold change±s.e.m. relative to an untreated control (d). MMP-2 protein levels in the conditioned media are normalized to the total protein concentration in the cell lysates (ng/mg) and displayed as the mean of the absolute values±s.e.m. (e). Statistical analysis: Nutlin-3-treated cells compared with control-treated cells: *P<0.05, ***P<0.001.

