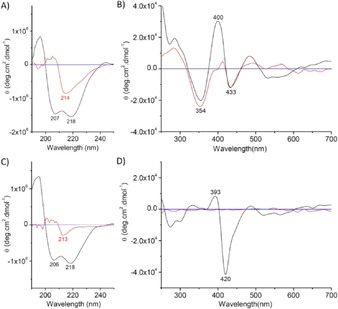
Figure 3.

A, B) CD spectra of N57C/S71C Cyt b 5 and C, D) WT Cyt b 5 in the far‐UV (A, C) and near‐UV/Vis (B, D) regions in the absence (black line) and presence (red line) of 6 m Gdn⋅HCl in potassium phosphate buffer (100 mm, pH 7.0) at 25 °C. The horizontal line with a value of zero is shown in blue.
